Gold turned mildly corrective on Monday, retreating from the 5-month high established on Friday at $1997.26. The yellow metal had become quite overbought after notching two consecutive weeks of solid gains in the wake of the Hamas attack on Israel.
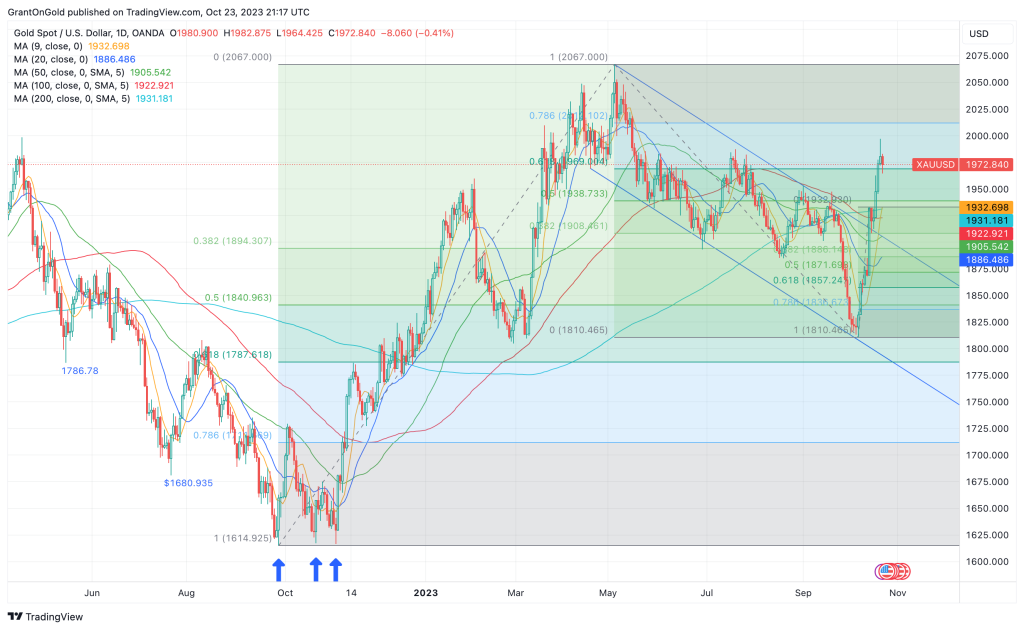 Spot Gold Daily Chart through 10/23/2023
A modicum of optimism surfaced with the recent release of a small number of hostages by Hamas. The Biden administration has asked Israel to delay any ground invasion as they attempt to negotiate the release of more hostages.
Israel has allowed several aid convoys to enter Gaza via the Rafah crossing from Egypt, an easing of the initial total blockade.
However, the death toll continues to rise in Gaza as withering Israeli airstrikes continue. Concerns that the conflict could expand are considerable.
Skirmishes have already erupted on Israel’s borders with Lebanon and Syria. Over the weekend an Israeli tank “accidentally” fired on an Egyptian border post. There were also reports that Israeli missiles struck airports in Syria.
The U.S. continues to send military aid to Israel in the form of advisors and replenishment of ammunition drawn down in the first weeks of the war. The U.S. is also positioning military assets in the region, including two carrier strike groups, as a strong warning to regional actors that might consider getting involved.
As long as geopolitical tensions remain elevated, the downside in gold should be limited. Monday’s low at $1964.42 protects secondary support at $1953.05/$1946.33, and more important chart/Fibonacci support at $1927.24/$1925.90.
On the upside, $2000 is the next significant barrier, which is bolstered by Friday’s high at $1997.26. A push above $2000 would highlight the May high at $2067 with potential to the all-time high of $2075.28 in 2020.
Silver
Silver gained nearly 3% last week. It was the second consecutive higher weekly close, but the white metal was unable to sustain the initial push back above the 100- and 200-day moving averages.
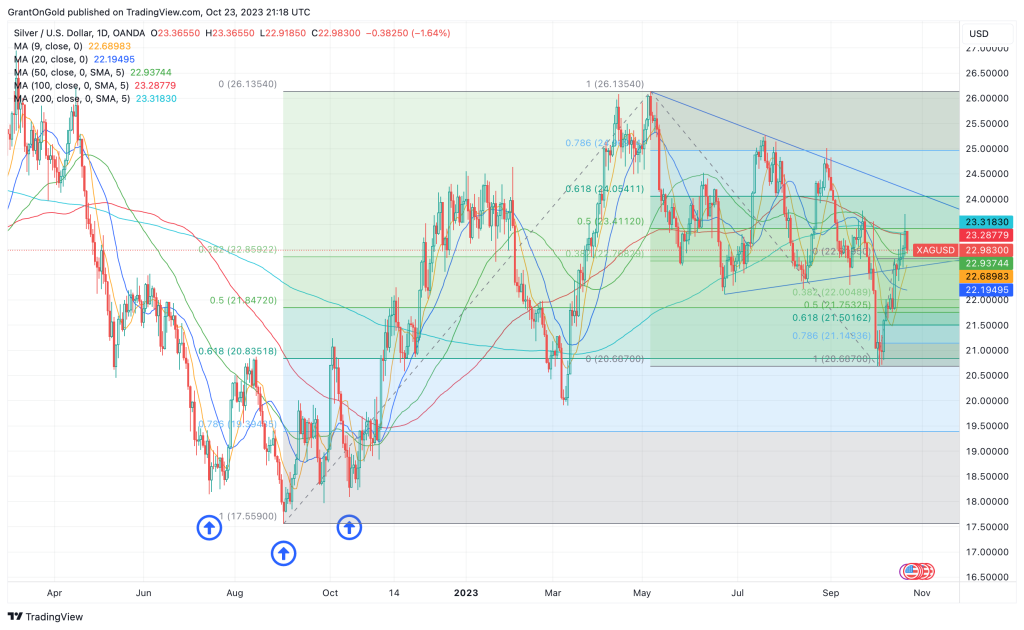 Spot Silver Daily Chart through 10/23/2023
Silver has certainly garnered flight-to-quality support over the past two weeks. In fact, silver gains since the Hamas attack on Israel have been greater than those of gold. However, the white metal is arguably more vulnerable to the persistent rise in U.S. rates.
On Monday, the U.S. 10-year yield exceeded 5% for the first time since 2007. Advance Q3 GDP comes out on Thursday and median expectations at for a +4.5% print, although the whisper is +5.0%
Growth that is more than double that of Q2 has rather dire implications for inflation. At the moment Fed funds futures continue to suggest the central bank is on pause through year-end, but a GDP beat and a strong PCE chain price index print on Friday would likely increase the probability of a December rate hike.
Given the geopolitical risks and rising yields, it’s hard to believe recent downticks on the dollar are anything other than corrective. If the greenback resumes its climb, short-term upside potential in silver may be limited.
A definitive push above $24 would set a more favorable tone within the range. Friday’s high at $23.70 now provides a good intervening barrier.
A retreat below support at $22.19 would suggest a weaker tone, with potential back to $21.83.
PGMs
While platinum has posted two consecutive higher weekly closes, it remains below the midpoint of the Covid-era range. Upticks have been lackluster, suggesting the downside remains vulnerable.
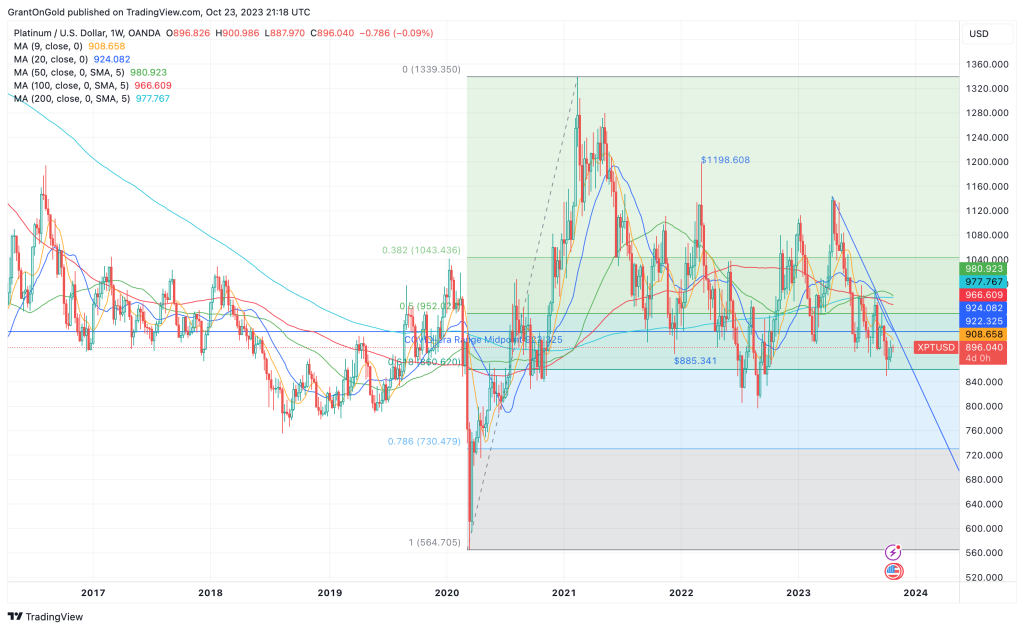 Spot Platinum Daily Chart through 10/23/2023
Fresh lows for the year below the 06-Oct low at $849.25 would lend credence to the scenario that calls for a challenge of last year’s low at $796.33. A rebound above $922.32/926.66 would ease short-term pressure on the downside somewhat.
Palladium remains on the ropes after reaching a new 5-year low on Monday. While a key reversal occurred, any follow-through gains that materialize would be viewed as corrective within the well-established downtrend.
Non-Reliance and Risk Disclosure: The opinions expressed here are for general information purposes only and should not be construed as trade recommendations, nor a solicitation of an offer to buy or sell any precious metals product. The material presented is based on information that we consider reliable, but we do not represent that it is accurate, complete, and/or up-to-date, and it should not be relied on as such. Opinions expressed are current as of the time of posting and only represent the views of the author and not those of Zaner Metals LLC unless otherwise expressly noted.